History — the map vs. the tape
Every morning before the open, WallMap Algo PRO publishes its map: institutional walls, operating ranges, zero-gamma, anchored VWAPs. This page looks back — the levels exactly as they were published before the open, next to what the session actually did. Closed days only: the current map is never shown here. New entries are added as days close.
You will find both kinds of days in this archive — days when price respected the walls to the point, and days when a regime break ran straight through them. That is the point. The map is context, not prophecy: it tells you where the market has built its defenses, not what price must do. The decision — and the risk — is always yours.
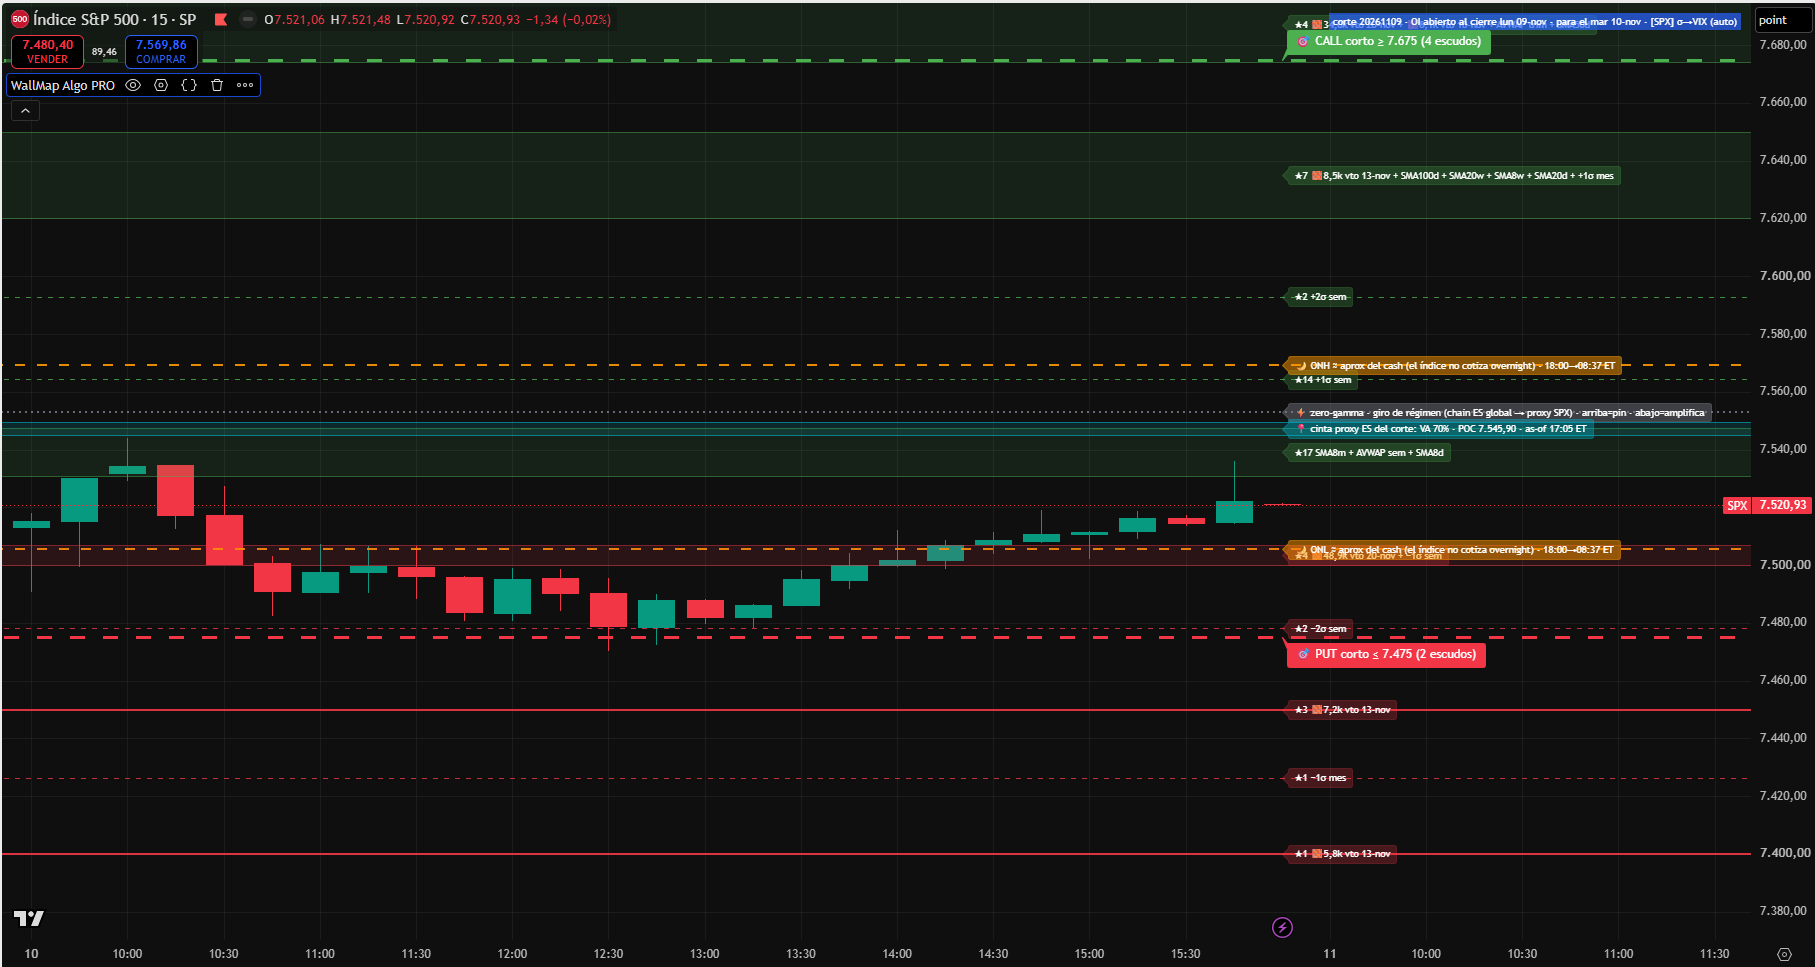
Tuesday, November 10, 2026 — SPX: a session contained by the map
Published before the open
- SPX operating range: 7,400–7,690
- Lower defense: put zone at 7,475, with the weekly −2σ band at ≈7,478
- Immediate ceiling: the moving-average and VWAP cluster at ≈7,531–7,547, the cut's POC at 7,545.90 and zero-gamma at 7,552.96
- Distant call zone at 7,675
What the session did
- At midday price pierced the put zone by less than five points — low of 7,470.43 — and buyers showed up right there: the published defense was bought back immediately.
- The rebound died exactly where the map had the ceiling: high of 7,543.92, two points under the published POC, never reaching zero-gamma.
- The 7,675 call zone was never in play. Close: 7,520.93, inside the published range.
What was respected and what was not: the published floor was pierced for minutes and bought back; the value-area ceiling stopped the rebound cold; and the edges of the range were never touched. The map did not guess the close — it marked the two exact spots where the session changed hands.
Want the map before the open, not after? The current levels are published every premarket for subscribers. How do I get the indicator?